Have you ever wondered how successful businesses are able to connect with their target audience on a deeper level? How do they understand their customers’ needs and preferences so well? It all starts with affinity grouping, a data analysis technique that can unlock valuable insights and revolutionize your marketing strategies.
Affinity grouping, also known as market segmentation or customer profiling, allows you to classify your target audience into distinct groups based on their shared characteristics, preferences, and behaviors. By understanding the commonalities among different segments, you can tailor your marketing efforts to meet their specific needs, ensuring your message resonates with them on a personal level.
But how exactly does affinity grouping work? And how can it help you gain a competitive edge in today’s fast-paced business landscape? Let’s delve deeper into this powerful technique and explore how it can transform the way you analyze data.
Key Takeaways:
- Affinity grouping, also known as market segmentation or customer profiling, is a data analysis technique that classifies your target audience into distinct groups based on shared characteristics.
- By understanding your audience segments, you can tailor your marketing strategies to meet their specific needs and preferences.
- Affinity grouping can provide valuable insights that help you make informed business decisions and create more effective marketing campaigns.
- It is a powerful tool for understanding customer behavior, identifying market opportunities, and increasing customer satisfaction.
- With affinity grouping, you can create personalized experiences that resonate with your target audience, enhancing brand loyalty and driving business growth.
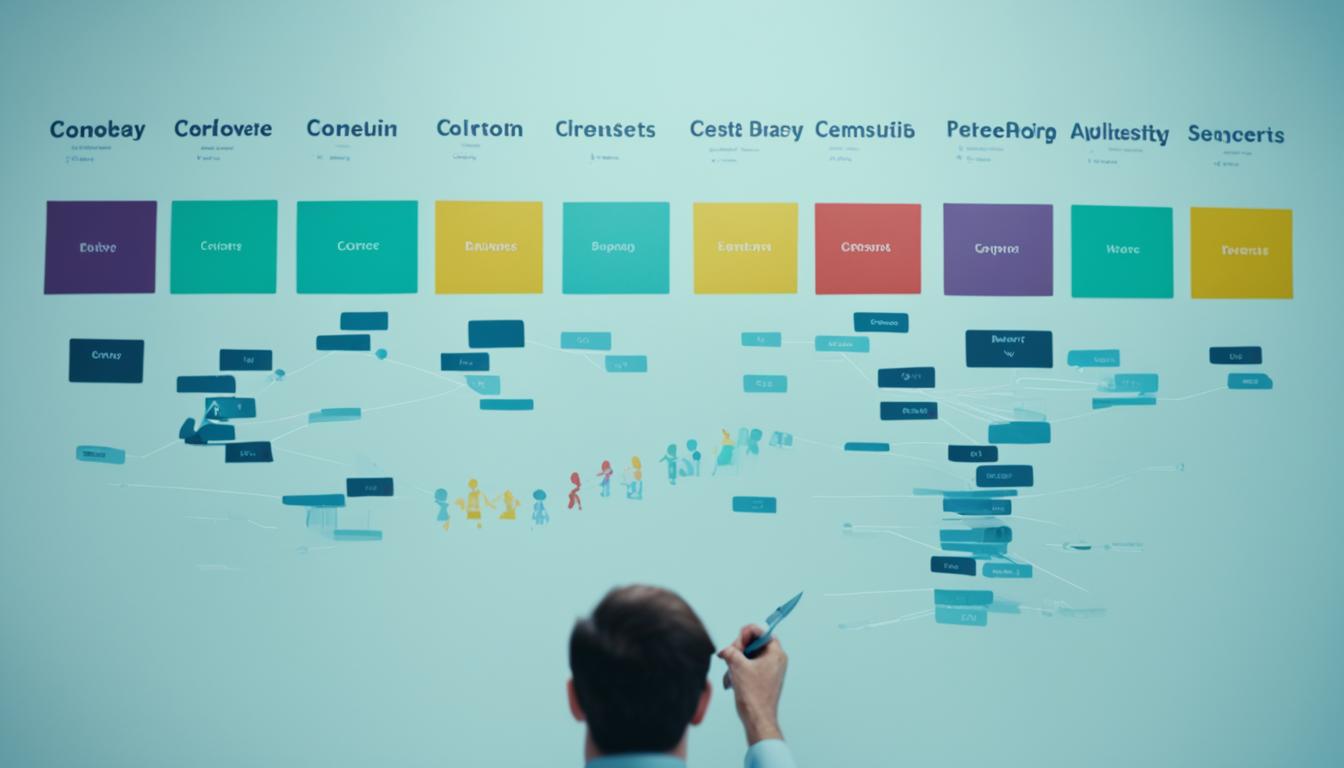
What is an Affinity Diagram?
An affinity diagram is a powerful tool used to organize large amounts of data into groups or themes based on their natural relationships. It is commonly used in research and design processes to make sense of insights gathered or ideas generated. The process of creating an affinity diagram involves the following steps:
- Collect data: Gather all relevant data, insights, or ideas from various sources.
- Generate affinity cards: Write each data point, insight, or idea onto individual cards. Use sticky notes or digital tools for easy rearrangement.
- Group similar cards: Look for commonalities, patterns, or themes among the cards and group them together. This step helps in organizing the data and finding connections.
- Create headers: Write concise headers or labels for each group of cards to represent the main themes or categories.
- Analyze relationships: Analyze the relationships between different groups, considering how they relate to each other.
- Synthesize insights: Synthesize the insights or conclusions that emerge from the patterns and relationships discovered.
By visually representing the relationships and patterns within the data, an affinity diagram enables clearer data organization, enhances insight synthesis, and facilitates the design process. It enables teams to uncover hidden connections, identify trends, and generate actionable ideas. Using this method, you can transform a jumble of data into a coherent and organized structure, empowering you to make informed decisions and drive effective solutions.

How to Use an Affinity Diagram
Once you have created an affinity diagram, you can leverage the organized data to enhance your data analysis and inform various aspects of your design and marketing process. Here are some key ways you can utilize an affinity diagram:
Data Analysis:
An affinity diagram allows you to analyze your data more effectively by identifying patterns, trends, and relationships among different elements. By visually grouping related data points, you can gain deeper insights into customer preferences, behaviors, and demographics. This systematic approach enables you to make data-driven decisions and fine-tune your strategies accordingly.
Empathy Mapping and Persona Creation:
Empathy mapping and persona creation are essential steps in understanding your target audience. Using the insights from your affinity diagram, you can identify common characteristics, pain points, and aspirations of specific customer segments. By developing empathy maps and creating detailed personas, you can foster a deeper understanding of your customers’ needs, motivations, and goals, allowing you to tailor your products, services, and messaging to better resonate with them.
Problem Statement Formulation:
The affinity diagram helps you distill complex data into actionable problem statements. By organizing related insights, you can identify recurring issues or challenges faced by your target audience. This enables you to pinpoint specific problems that need solving and prioritize them based on their impact and feasibility. The problem statements derived from the affinity diagram serve as a solid foundation for ideation and solution development.
Ideation and Solution Generation:
An affinity diagram serves as a catalyst for ideation and solution generation. By clustering similar ideas and observations, you can uncover themes and opportunities that can spark innovative thinking. The organized data enables cross-pollination of ideas within your team and fosters collaboration. Through brainstorming sessions, you can generate creative solutions that address the identified problems and align with the needs and desires of your target audience.
By utilizing the power of affinity diagrams in your data analysis process, you can gain actionable insights, build customer-centric strategies, and drive innovation across your organization. The organized data empowers you to make informed decisions that resonate with your target audience and deliver impactful results.
FAQ
What is affinity grouping, and why is it important?
What is an affinity diagram, and how does it aid in data organization?
How do you create an affinity diagram?
What are some ways to use an affinity diagram?
Source Links
- https://deeprojectmanager.com/affinity-diagram-pmp/
- https://projectmanagementacademy.net/resources/blog/grow-your-affinity-for-pmp-planning-tools/
- https://www.interaction-design.org/literature/article/affinity-diagrams-learn-how-to-cluster-and-bundle-ideas-and-facts